🍕 Pizza_Runner – Delivery & Sales Analytics
SQL-Based Pizza Delivery Analytics Project
The Pizza_Runner project analyzes order patterns, delivery efficiency, and customer preferences using SQL analytics. By using advanced queries, joins, and window functions, the project identifies peak order times, popular pizza types, delivery delays, and customer behavior trends, helping the business optimize operations, improve delivery times, and enhance customer satisfaction.

Project Highlights
About the Project
Overview
The Pizza_Runner project provides insights into pizza delivery operations and customer ordering patterns. It integrates orders, deliveries, and customer data to analyze performance, optimize delivery times, and identify top-selling products. SQL analytics help make data-driven decisions for marketing, menu optimization, and operational efficiency.
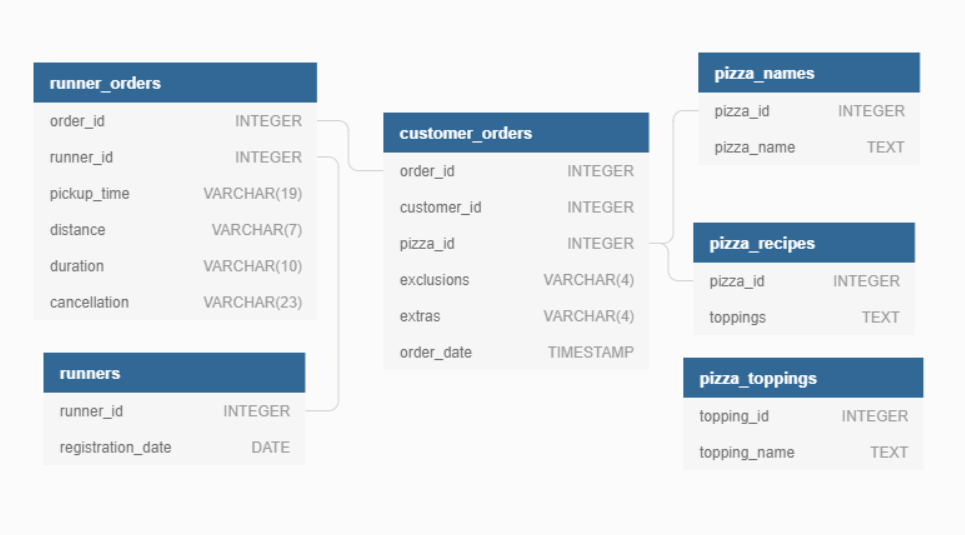
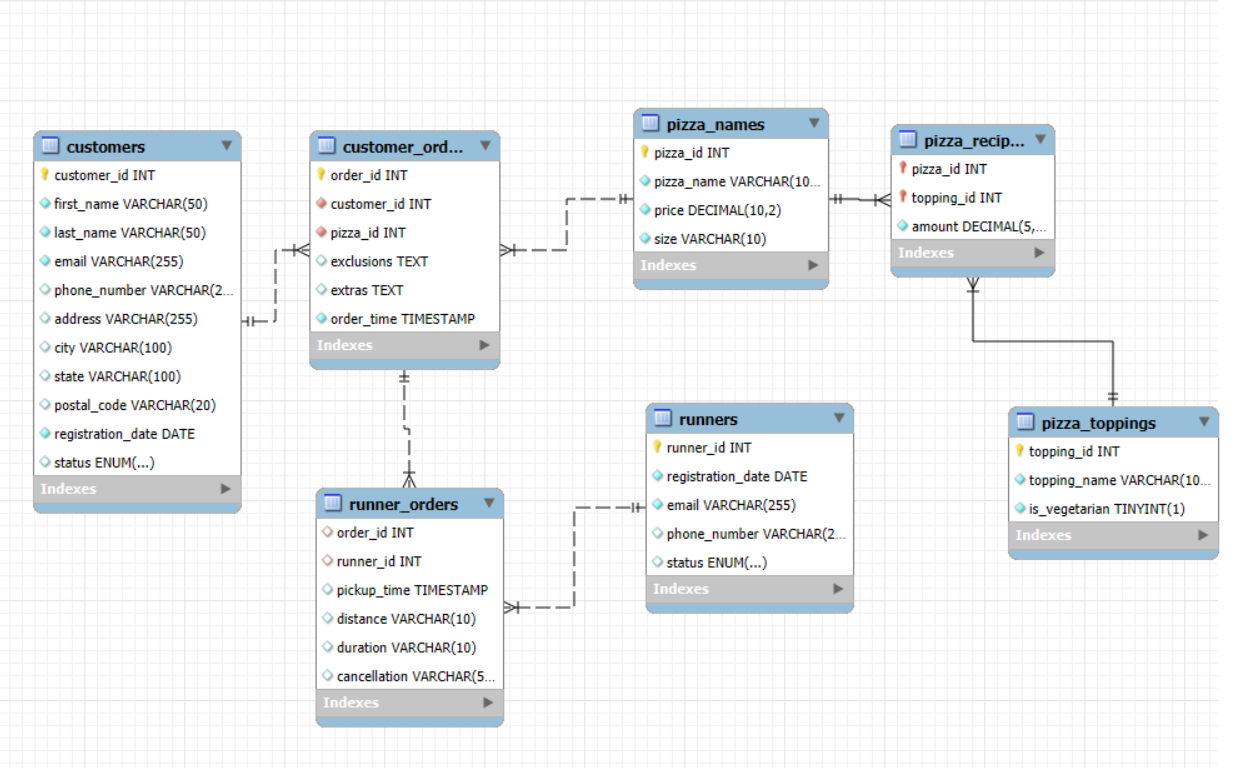
SQL Process & Data Modeling
- 📥 Extract: Combined order, delivery, customer, and menu item tables.
- 🧹 Transform: Cleaned timestamps, standardized pizza names, and handled missing values.
- 🔍 Analyze: Applied window functions, ranking, and joins to assess orders, delivery times, and customer segments.
- 📊 Model: Designed a data mart connecting orders, customers, and deliveries for detailed analytics.

Key Insights
- 🍕 Top 5 pizzas contributed to 60% of total revenue.
- 📈 Peak order times were between 7 PM – 9 PM, suggesting optimal delivery staffing schedules.
- 👥 Repeat customers had higher average order values than new customers.
- 🌍 Delivery zones with faster times showed higher customer satisfaction scores.
When:
2025
Mode:
SQL Data Analysis
Dataset:
Orders, Customers & Delivery Logs
Focus:
Delivery Efficiency & Customer Insights
Project Snapshots
Business Impact
📊 Optimized delivery routes and reduced late deliveries based on SQL-driven insights.
💬 Enhanced customer satisfaction through insights on peak order times and repeat orders.
🚀 Increased revenue by highlighting top-selling pizzas and high-value customer segments.
Challenges & Learnings
⚙️ Handling multiple tables for orders, customers, and deliveries efficiently using SQL.
🧩 Identifying trends and performance metrics for operational and marketing improvements.
💡 Strengthened skills in SQL analytics, operational data modeling, and customer-focused insights.